Data › Who Fills Your Day?
Who Fills Your Day?
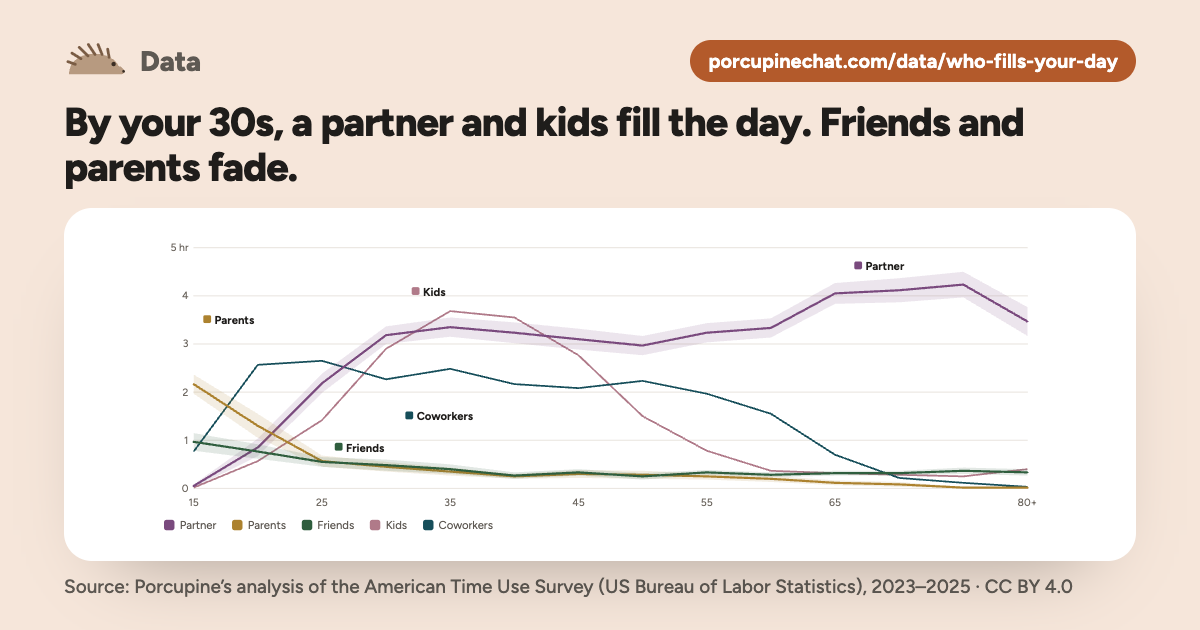
By your 30s, a partner and kids fill the day. Friends and parents fade.
At 30, Americans average about 30 min a day with friends, about half what they had at 15. Here are the average hours a day with each, at every age.
Numbers last updated October 2026. We refresh them each summer, when the Bureau of Labor Statistics releases a new year.
Porcupine’s analysis of the American Time Use Survey, US Bureau of Labor Statistics, which hasn’t reviewed these pages. 22,363 one-day diaries, 2023–2025. Shading shows each line’s margin of error.
Free to use, even commercially, under CC BY 4.0: credit Porcupine and link to this page.
Download the pictureChart: Porcupine, from the American Time Use Survey (CC BY 4.0). porcupinechat.com/data/who-fills-your-day
See the numbers
| Age | Partner | Parents | Friends | Kids | Coworkers |
|---|---|---|---|---|---|
| 15–19 | 5 min | 2 hr 10 min | 1 hr | under 5 min | 45 min |
| 20–24 | 50 min | 1 hr 20 min | 45 min | 35 min | 2 hr 35 min |
| 25–29 | 2 hr 10 min | 35 min | 35 min | 1 hr 25 min | 2 hr 40 min |
| 30–34 | 3 hr 10 min | 25 min | 30 min | 2 hr 55 min | 2 hr 15 min |
| 35–39 | 3 hr 20 min | 20 min | 25 min | 3 hr 40 min | 2 hr 30 min |
| 40–44 | 3 hr 15 min | 15 min | 15 min | 3 hr 35 min | 2 hr 10 min |
| 45–49 | 3 hr 5 min | 20 min | 20 min | 2 hr 45 min | 2 hr 5 min |
| 50–54 | 3 hr | 15 min | 15 min | 1 hr 30 min | 2 hr 15 min |
| 55–59 | 3 hr 15 min | 15 min | 20 min | 45 min | 2 hr |
| 60–64 | 3 hr 20 min | 10 min | 15 min | 20 min | 1 hr 35 min |
| 65–69 | 4 hr 5 min | 5 min | 20 min | 20 min | 40 min |
| 70–74 | 4 hr 5 min | 5 min | 20 min | 15 min | 15 min |
| 75–79 | 4 hr 15 min | under 5 min | 20 min | 15 min | 5 min |
| 80+ | 3 hr 30 min | under 5 min | 20 min | 25 min | under 5 min |
Average a day for everyone that age, single or not. Hover or tap the chart for each margin of error.
Find people like you
Pick a country, an age, kids and work.
What the numbers show
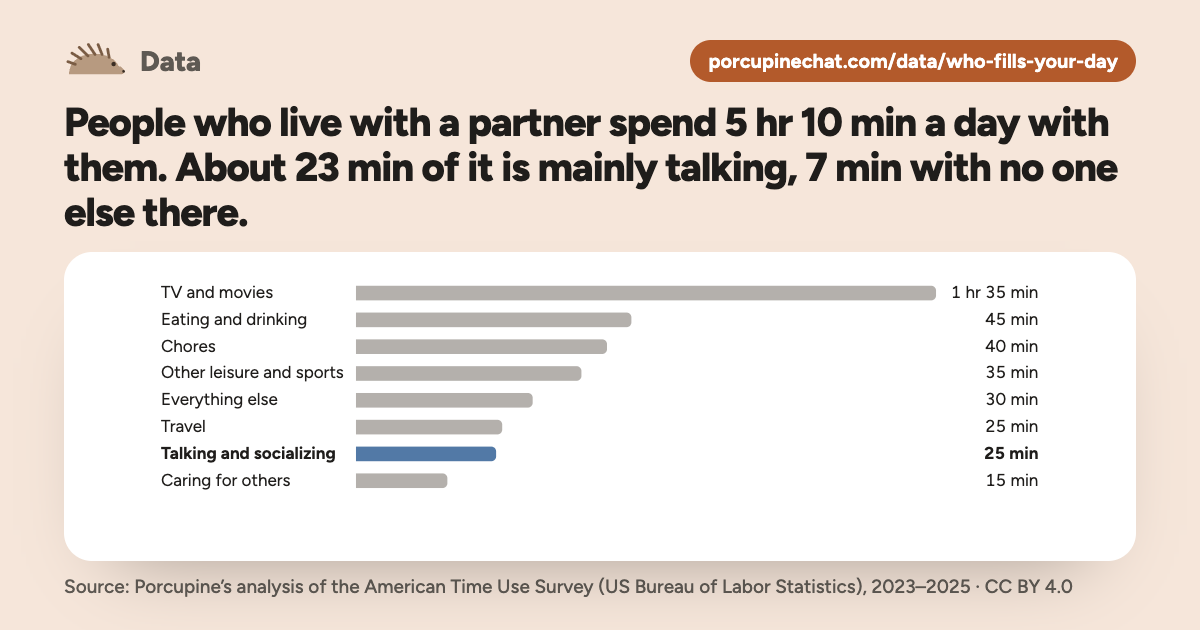
People who live with a partner spend 5 hr 10 min a day with them. About 23 min of it is mainly talking, 7 min with no one else there.
What they do in that time, on average a day.
“Mainly talking” is time when talking or socializing was the main thing they were doing, so talk over dinner counts as eating. Other people can be there too: 7 min of the 23 min has no one else there. Parents with a child at home: 20 min of 5 hr 20 min with their kids is mainly talking.
Free to use, even commercially, under CC BY 4.0: credit Porcupine and link to this page.
Download the pictureChart: Porcupine, from the American Time Use Survey (CC BY 4.0). porcupinechat.com/data/who-fills-your-day
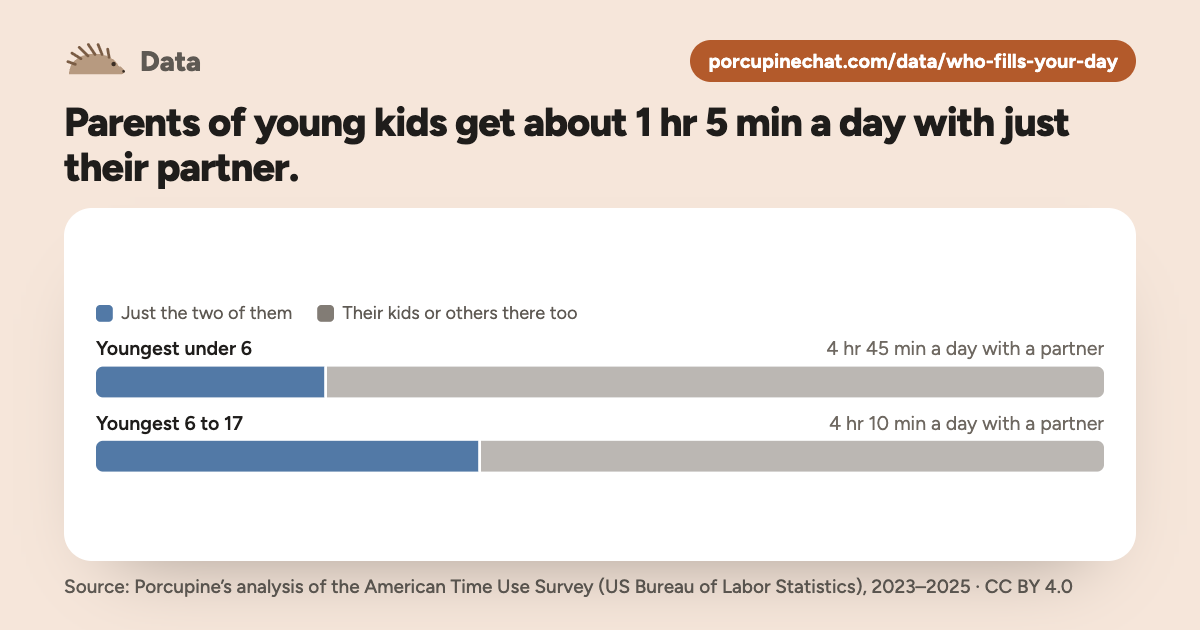
Parents of young kids get about 1 hr 5 min a day with just their partner.
Parents living with a partner and their own child under 18. “Just the two of them” means no one else was in the room at home, or with them when out. For parents whose youngest is under 6, about half of it comes after 8 p.m.
Free to use, even commercially, under CC BY 4.0: credit Porcupine and link to this page.
Download the pictureChart: Porcupine, from the American Time Use Survey (CC BY 4.0). porcupinechat.com/data/who-fills-your-day
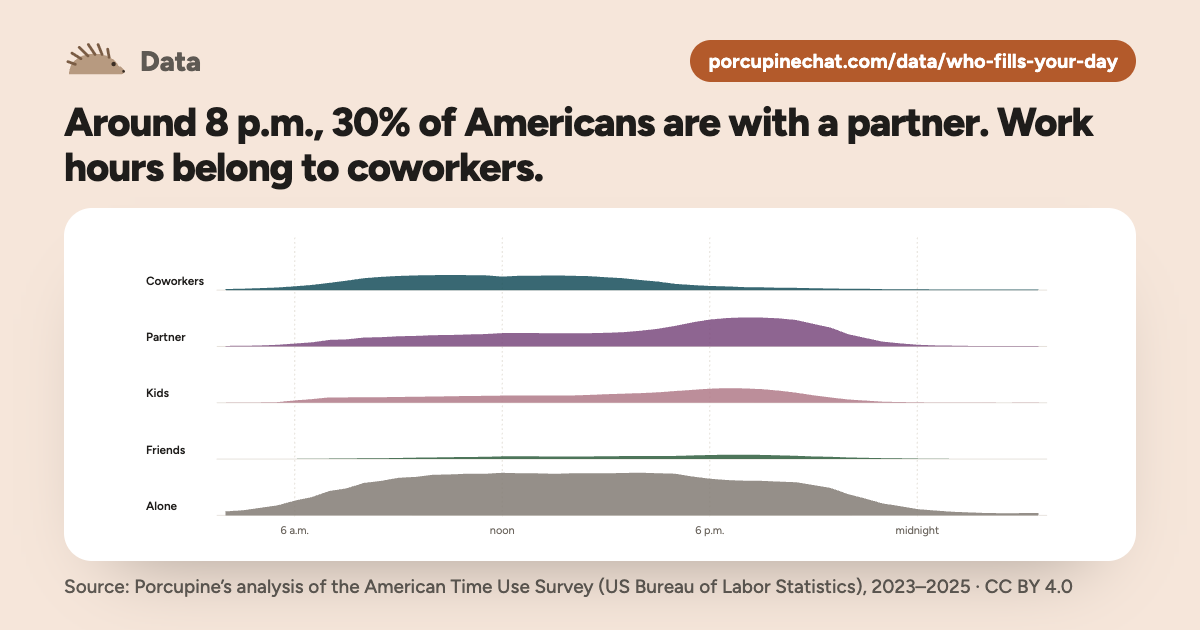
Around 8 p.m., 30% of Americans are with a partner. Work hours belong to coworkers.
The share of all Americans 15 and older with each kind of person, through the day. Sleep and getting ready aren’t counted.
Free to use, even commercially, under CC BY 4.0: credit Porcupine and link to this page.
Download the pictureChart: Porcupine, from the American Time Use Survey (CC BY 4.0). porcupinechat.com/data/who-fills-your-day
See the numbers
| Time | Coworkers | Partner | Kids | Friends | Alone |
|---|---|---|---|---|---|
| 6 a.m. | 4% | 3% | 3% | 0% | 16% |
| 8 a.m. | 13% | 9% | 6% | 1% | 34% |
| 10 a.m. | 16% | 12% | 7% | 2% | 43% |
| Noon | 14% | 14% | 8% | 3% | 45% |
| 2 p.m. | 15% | 14% | 8% | 3% | 45% |
| 4 p.m. | 11% | 17% | 10% | 3% | 45% |
| 6 p.m. | 4% | 29% | 15% | 4% | 39% |
| 8 p.m. | 3% | 30% | 13% | 4% | 36% |
| 10 p.m. | 1% | 13% | 4% | 2% | 23% |
| Midnight | 1% | 2% | 1% | 1% | 7% |
The share of all Americans 15 and older with each kind of person in the half hour starting then.
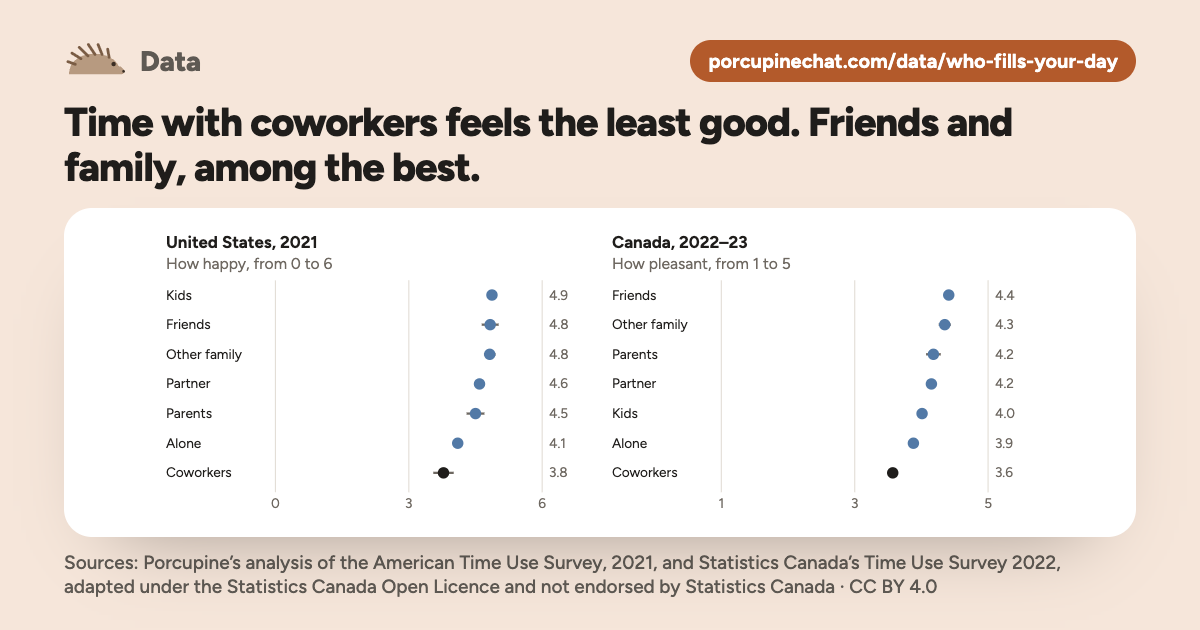
In both countries, time with coworkers feels the least good, and time with friends and family among the best.
How people rated what they were doing while each kind of person was there. Each country asked its own way, so compare the order, not the numbers.
United States, 2021
How happy, from 0 to 6
Canada, 2022–23
How pleasant, from 1 to 5
The ratings are for the activity, so they don’t show that the person caused the feeling. Americans also felt most stressed with coworkers, but time with coworkers is mostly time at work, so the rating is partly about the work. The US ratings are from 2021, during the pandemic.
Free to use, even commercially, under CC BY 4.0: credit Porcupine and link to this page.
Download the pictureChart: Porcupine, from the American Time Use Survey and Statistics Canada’s Time Use Survey 2022, adapted under the Statistics Canada Open Licence and not endorsed by Statistics Canada (CC BY 4.0). porcupinechat.com/data/who-fills-your-day
See the numbers
| With | United States (0 to 6) | Canada (1 to 5) |
|---|---|---|
| Alone | 4.1 (±0.1) | 3.9 (±0.0) |
| Partner | 4.6 (±0.1) | 4.2 (±0.0) |
| Kids | 4.9 (±0.1) | 4.0 (±0.1) |
| Parents | 4.5 (±0.2) | 4.2 (±0.1) |
| Other family | 4.8 (±0.1) | 4.3 (±0.1) |
| Friends | 4.8 (±0.2) | 4.4 (±0.1) |
| Coworkers | 3.8 (±0.2) | 3.6 (±0.1) |
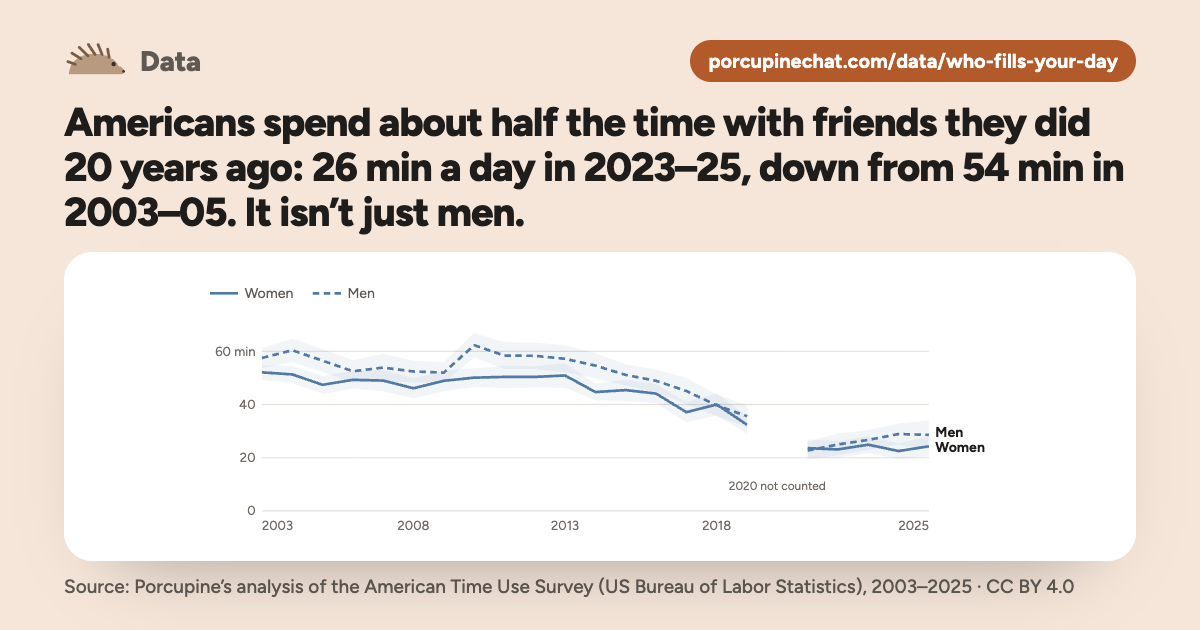
Americans spend about half the time with friends they did 20 years ago: 26 min a day in 2023–25, down from 54 min in 2003–05. It isn’t just men.
Free to use, even commercially, under CC BY 4.0: credit Porcupine and link to this page.
Download the pictureChart: Porcupine, from the American Time Use Survey (CC BY 4.0). porcupinechat.com/data/who-fills-your-day
See the numbers
| Year | Everyone | Women | Men |
|---|---|---|---|
| 2003 | 55 min | 50 min | 1 hr |
| 2004 | 55 min | 50 min | 1 hr |
| 2005 | 50 min | 45 min | 55 min |
| 2006 | 50 min | 50 min | 55 min |
| 2007 | 50 min | 50 min | 55 min |
| 2008 | 50 min | 45 min | 50 min |
| 2009 | 50 min | 50 min | 50 min |
| 2010 | 55 min | 50 min | 1 hr |
| 2011 | 55 min | 50 min | 1 hr |
| 2012 | 55 min | 50 min | 1 hr |
| 2013 | 55 min | 50 min | 55 min |
| 2014 | 50 min | 45 min | 55 min |
| 2015 | 50 min | 45 min | 50 min |
| 2016 | 45 min | 45 min | 50 min |
| 2017 | 40 min | 35 min | 45 min |
| 2018 | 40 min | 40 min | 40 min |
| 2019 | 35 min | 30 min | 35 min |
| 2021 | 25 min | 25 min | 25 min |
| 2022 | 25 min | 25 min | 25 min |
| 2023 | 25 min | 25 min | 25 min |
| 2024 | 25 min | 25 min | 30 min |
| 2025 | 25 min | 25 min | 30 min |
Average a day with friends, leaving out work and school class in every year. 2020 isn’t counted, since the survey stopped for two months.
Only about 1 in 6 parents whose children under 18 live in another home spends any time with them on a given day.
Parents whose children under 18 live in another home spend about 40 min a day with them, on average, give or take 10 min.
Americans 15 and older with a child under 18 who lives elsewhere, 2015–2019 and 2021–2025, 917 diaries. The rest of this page is 2023–2025.
On a typical day, more than half of people who live with roommates spend no time with them at all.
When they are together, about 3 in 4 of those hours are at home, much of it over TV and meals. And about 3 in 4 of their mealtime is spent without a roommate.
At 25 to 34, about 6% of Americans live with a roommate, up from 4% in 2003–07. People 15 and older who live with a housemate or roommate, 2021–2025, 718 diaries.
Common questions
How much time do people spend with other people each day?
Americans 15 and older average about 7 hr 20 min a day with other people and 6 hr 45 min alone, counting every day of the week. The rest is sleep, washing and dressing, when the survey doesn’t ask who was there.
Who do people spend the most time with?
A partner, for most adults. People who live with one average about 5 hr 10 min a day with them. Parents with a child at home average about 5 hr 20 min with their kids, and people who work spend hours with coworkers.
Where do these numbers come from?
From one-day diaries in the American Time Use Survey, run by the US Census Bureau for the Bureau of Labor Statistics, and Statistics Canada’s Time Use Survey. Porcupine works out the averages and their margins of error.
How often are the numbers updated?
Each summer, when the Bureau of Labor Statistics releases a new year of diaries. They were last updated in October 2026.
Write to someone who fills your day
Write it the way it comes out. I’ll show you if the quills are up, and a version with them down.
The Quills Check needs JavaScript. Please turn it on and reload the page.
This survey doesn’t count texts or calls, and that’s where a lot gets misread.
Play Mixed Signals, a daily game about what texts mean, or check a text you got.
Find the words with Porcupine
PorcupineThe people you see most are the ones the hard talks are with. I can help with the whole conversation: your reply, getting ready to say it in person, or a chat where you both get a coach.
Porcupine is coming soon. Sign up to be one of the first to try it.
We’ll email you when Porcupine opens and when we add new tools. Unsubscribe anytime. Privacy
More from the data
- How much time do couples spend together?5 hr 10 min a day, and what they do with it
- How much time do people spend with friends?By age, who sees friends least, and how it feels
- Are we in a friendship recession?Which ages lost the most time with friends since 2003, and where it went
- How much of your time with your parents is behind you?Pick your age to see your share
- How much time do people spend with family on the holidays?Thanksgiving, Christmas and five more holidays, by the clock
- What do neighbors complain about, and when?New York City’s 311 complaints, by hour, week and season
- How often do people ask for a raise, or for help with money?Who asks, who gets a raise, and who gets help paying the bills
- How often do renters need repairs, or fall behind on rent?Repairs, rent and running late, for renters
- Do Americans still know their neighbors?Evenings with neighbors, friends and family since the 1970s
- When are people most alone, and who still calls?The hour the most people are alone, and who still calls
- How has the way we say sorry changed?Sorry, pardon and “sorry if,” in books since 1800
- Do couples agree on who does more at home?Chores, money and marriage, as women and men each tell it
- When did therapy-speak go mainstream?Boundaries, ghosting, gaslighting: in books, on Wikipedia and in searches
- What people asked advice columns, then and nowCourting faded, family took its place: 28,539 letters, a hundred years apart
- Etiquette then and now: which of Emily Post’s rules on what to say still hold?Her 73 rules from 1922: we’d keep 50, and every one we’d change said to keep your feelings, wants or questions to yourself
How we counted
- Each person in the survey goes through one day, hour by hour, and who was with them: in the same room at home, or with them when out. In the United States, they go through the day before with an interviewer on the phone. Calls, texts and video chats don’t count, and nobody is asked who was there while they slept, washed or dressed.
- Every number is an average from a sample, weighted to stand for people 15 and older living in their own homes, so each comes with a margin of error. Hover or tap a chart to see it. Numbers too uncertain to trust are left out.
More on how we counted
- Time can count twice: a dinner with a partner and the kids counts for both.
- The lifetime chart compares people of different ages today, not one life followed over the years.
- The 2025 US numbers have no diaries from September 30 to November 11, when a federal shutdown stopped the survey. The Bureau of Labor Statistics says it can’t measure the effect, though the survey has shown little change by season in the past.
- “By the clock” shows the share of all Americans 15 and older, single or not, with each kind of person in each half hour. “How it feels” uses the US survey’s 2021 well-being module, about 20,000 activities people rated for how happy and stressed they felt, and Canada’s 1 to 5 rating of how pleasant each activity was. Canada’s survey also asks who was there during sleep and personal care; those hours are left out here, as for the United States.
- In the tool, Canada’s “Children at home” are any children living with them, parents count with parents-in-law and coworkers with classmates. The two countries’ surveys ask in different ways and in different years, so compare the patterns within each country rather than the numbers between them.
- Source: Porcupine’s analysis of the American Time Use Survey, US Bureau of Labor Statistics, which hasn’t reviewed these pages. Adapted from Statistics Canada, Time Use Survey 2022, public use microdata file, under the Statistics Canada Open Licence. This does not constitute an endorsement by Statistics Canada of this product.
Updated