Data › Friendship recession
Are we in a friendship recession?
Yes. Americans spend about half the time with friends they did 20 years ago. People 15 to 24 lost the most, over an hour a day.
Numbers last updated November 2026. We refresh them each summer, when the Bureau of Labor Statistics releases a new year.
- 2003–05
- 2023–25
- A day with friends, Americans 15 and older
- 54 min
- 26 min
- People 15 to 24 who saw a friend at all on a given day
- 45%
- 22%
- Time on the phone with friends
- 1 min more. Calls made up for very little of it.
Every age lost about half
15 to 24 lost the most: 1 hr 15 min a day.
Every age lost 40% to 59% of its time with friends.
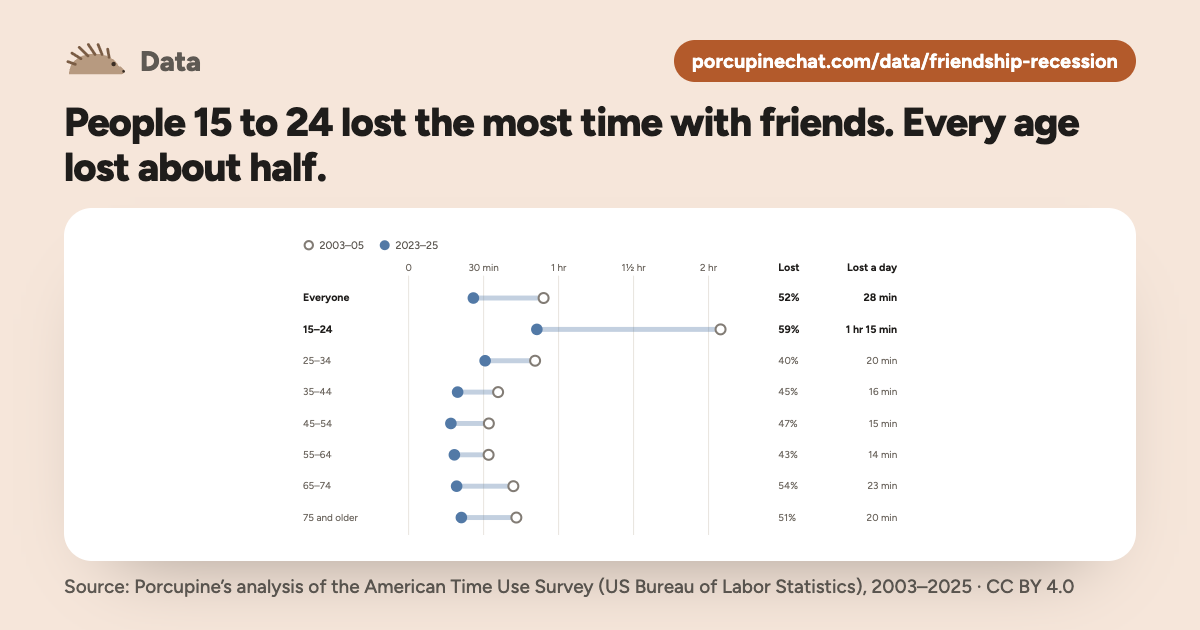
Free to use, even commercially, under CC BY 4.0: credit Porcupine and link to this page.
Download the pictureChart: Porcupine, from the American Time Use Survey (CC BY 4.0). porcupinechat.com/data/friendship-recession
See the numbers
| Age | 2003–05 | 2023–25 | Lost a day | Lost |
|---|---|---|---|---|
| Everyone | 54 min (± a few min) | 26 min (± a few min) | 28 min (± a few min) | 52% |
| 15–24 | 2 hr 5 min (± 5 min) | 50 min (± 5 min) | 1 hr 15 min (± 10 min) | 59% |
| 25–34 | 51 min (± a few min) | 31 min (± a few min) | 20 min (± 5 min) | 40% |
| 35–44 | 36 min (± a few min) | 20 min (± a few min) | 16 min (± a few min) | 45% |
| 45–54 | 32 min (± a few min) | 17 min (± a few min) | 15 min (± a few min) | 47% |
| 55–64 | 32 min (± a few min) | 18 min (± a few min) | 14 min (± a few min) | 43% |
| 65–74 | 42 min (± a few min) | 19 min (± a few min) | 23 min (± a few min) | 54% |
| 75 and older | 43 min (± a few min) | 21 min (± a few min) | 20 min (± 5 min) | 51% |
Average a day with friends. Diaries: 47,731 in 2003–05 and 22,363 in 2023–25; for one age, 1,552 to 10,587.
It started before the pandemic
Steady until about 2013, falling since, and no bounce back after 2020.
53 mina day with friends, 2012–14
37 min2018–19, before the pandemic
26 min2023–25
A few years together, since a single year for one age swings too much. The shaded band is 15–24’s margin of error.
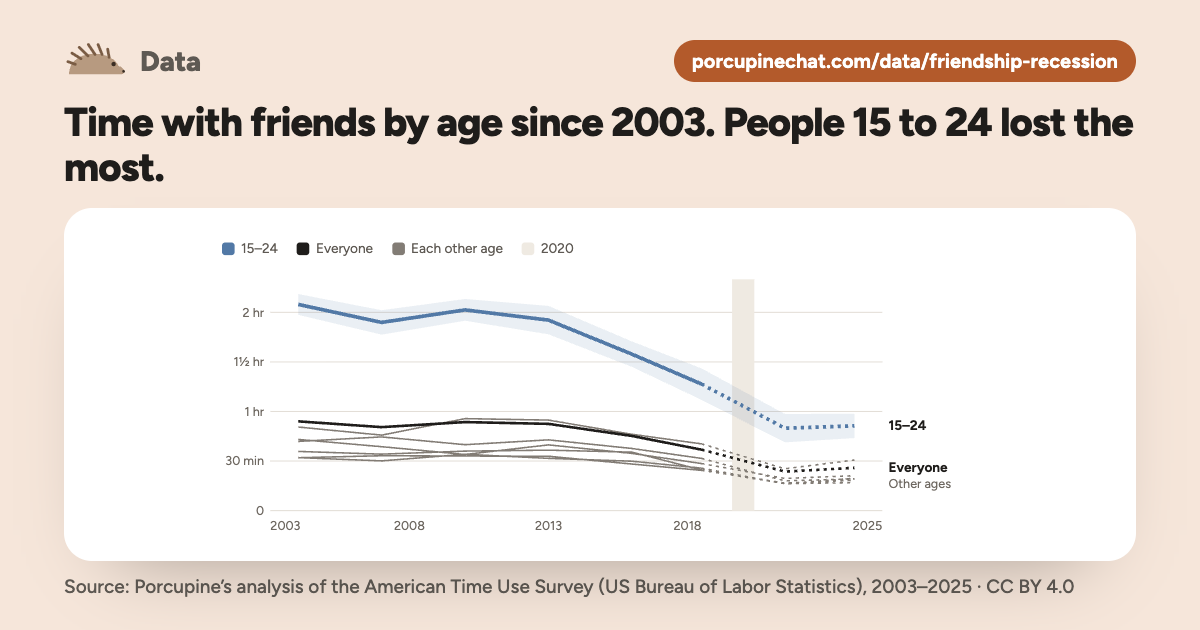
Free to use, even commercially, under CC BY 4.0: credit Porcupine and link to this page.
Download the pictureChart: Porcupine, from the American Time Use Survey (CC BY 4.0). porcupinechat.com/data/friendship-recession
See the numbers
| Age | 2003–05 | 2006–08 | 2009–11 | 2012–14 | 2015–17 | 2018–19 | 2021–22 | 2023–25 |
|---|---|---|---|---|---|---|---|---|
| Everyone | 54 min | 51 min | 54 min | 53 min | 45 min | 37 min | 24 min | 26 min |
| 15–24 | 2 hr 5 min | 1 hr 55 min | 2 hr | 1 hr 55 min | 1 hr 35 min | 1 hr 15 min | 50 min | 50 min |
| 25–34 | 51 min | 46 min | 56 min | 55 min | 46 min | 40 min | 25 min | 31 min |
| 35–44 | 36 min | 34 min | 36 min | 37 min | 35 min | 25 min | 16 min | 20 min |
| 45–54 | 32 min | 30 min | 34 min | 32 min | 30 min | 26 min | 16 min | 17 min |
| 55–64 | 32 min | 33 min | 33 min | 33 min | 28 min | 24 min | 17 min | 18 min |
| 65–74 | 42 min | 45 min | 40 min | 43 min | 38 min | 32 min | 18 min | 19 min |
| 75 and older | 43 min | 39 min | 34 min | 40 min | 35 min | 29 min | 20 min | 21 min |
Average a day with friends, a few years at a time. Each is give or take 2 to 10 minutes; hover or tap the chart for each. 2020 isn’t in these, since the survey stopped for two months.
Men and women each lost about half (52% and 52%).
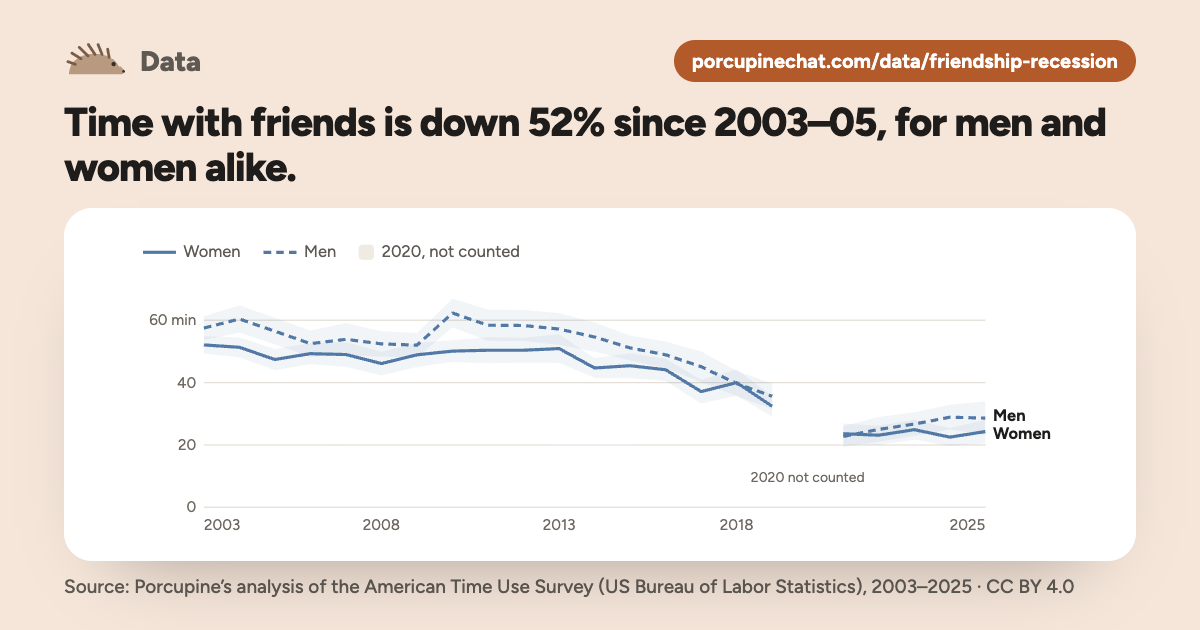
Free to use, even commercially, under CC BY 4.0: credit Porcupine and link to this page.
Download the pictureChart: Porcupine, from the American Time Use Survey (CC BY 4.0). porcupinechat.com/data/friendship-recession
See the numbers
| Year | Everyone | Women | Men | Diaries |
|---|---|---|---|---|
| 2003 | 55 min (± a few min) | 52 min (± a few min) | 58 min (± a few min) | 20,720 |
| 2004 | 56 min (± a few min) | 51 min (± a few min) | 1 hr (± a few min) | 13,973 |
| 2005 | 52 min (± a few min) | 47 min (± a few min) | 57 min (± a few min) | 13,038 |
| 2006 | 51 min (± a few min) | 49 min (± a few min) | 53 min (± a few min) | 12,943 |
| 2007 | 51 min (± a few min) | 49 min (± a few min) | 55 min (± 5 min) | 12,248 |
| 2008 | 49 min (± a few min) | 46 min (± a few min) | 52 min (± a few min) | 12,723 |
| 2009 | 50 min (± a few min) | 49 min (± a few min) | 52 min (± a few min) | 13,133 |
| 2010 | 56 min (± a few min) | 50 min (± a few min) | 1 hr (± a few min) | 13,260 |
| 2011 | 54 min (± a few min) | 50 min (± a few min) | 1 hr (± 5 min) | 12,479 |
| 2012 | 54 min (± a few min) | 50 min (± a few min) | 1 hr (± 5 min) | 12,443 |
| 2013 | 54 min (± a few min) | 51 min (± a few min) | 55 min (± 5 min) | 11,385 |
| 2014 | 50 min (± a few min) | 45 min (± a few min) | 55 min (± a few min) | 11,592 |
| 2015 | 48 min (± a few min) | 45 min (± a few min) | 51 min (± a few min) | 10,905 |
| 2016 | 46 min (± a few min) | 44 min (± a few min) | 49 min (± a few min) | 10,493 |
| 2017 | 41 min (± a few min) | 37 min (± a few min) | 45 min (± a few min) | 10,223 |
| 2018 | 40 min (± a few min) | 40 min (± a few min) | 40 min (± a few min) | 9,593 |
| 2019 | 34 min (± a few min) | 32 min (± a few min) | 36 min (± a few min) | 9,435 |
| 2020 | 20 min (± a few min) | 18 min (± a few min) | 21 min (± a few min) | 8,782 |
| 2021 | 23 min (± a few min) | 24 min (± a few min) | 23 min (± a few min) | 9,087 |
| 2022 | 24 min (± a few min) | 23 min (± a few min) | 25 min (± a few min) | 8,136 |
| 2023 | 26 min (± a few min) | 25 min (± a few min) | 27 min (± a few min) | 8,548 |
| 2024 | 26 min (± a few min) | 23 min (± a few min) | 29 min (± a few min) | 7,669 |
| 2025 | 26 min (± a few min) | 24 min (± a few min) | 30 min (± 5 min) | 6,146 |
Average a day with friends. 2020 has no diaries from mid-March to mid-May and its own weights, so the chart leaves it out.
Where the time went
Change in minutes a day, 2003–05 to 2023–25.
Ages 15–24: 1 hr 15 min less a day with friends, 1 hr 10 min more alone.
Faded rows: too close to call. Leaves out time at work.
See the numbers
| Everyone | 15–24 | 25–34 | 35–44 | 45–54 | 55–64 | 65–74 | 75 and older | |
|---|---|---|---|---|---|---|---|---|
| With friends | −28 min (±2) | −1 hr 15 min (±10) | −20 min (±6) | −16 min (±4) | −15 min (±3) | −14 min (±4) | −23 min (±5) | −20 min (±5) |
| With family | −35 min (±5) | −30 min (±16) | −1 hr 25 min (±13) | −10 min (±12) | −15 min (±11) | −50 min (±12) | −55 min (±15) | −5 min (±17) |
| With anyone at all | −1 hr 10 min (±5) | −2 hr 30 min (±17) | −1 hr 30 min (±13) | −30 min (±11) | −35 min (±11) | −1 hr 5 min (±12) | −1 hr 5 min (±14) | −15 min (±16) |
| Alone | +44 min (±5) | +1 hr 10 min (±15) | +1 hr (±12) | −under 5 min (±10) | +5 min (±11) | +20 min (±13) | +45 min (±14) | +5 min (±17) |
| Alone with a screen | +27 min (±3) | +45 min (±11) | +30 min (±8) | +under 5 min (±5) | +5 min (±7) | +20 min (±9) | +30 min (±10) | +15 min (±13) |
| Playing games | +12 min (±2) | +30 min (±7) | +22 min (±5) | +10 min (±3) | +7 min (±2) | +2 min (±3) | +2 min (±3) | +3 min (±3) |
| TV and movies | +2 min (±4) | −35 min (±10) | −20 min (±7) | −20 min (±7) | −10 min (±8) | +10 min (±8) | +25 min (±10) | +30 min (±11) |
| Sleeping | +28 min (±3) | +35 min (±11) | +30 min (±7) | +25 min (±6) | +35 min (±7) | +35 min (±6) | +15 min (±6) | +10 min (±7) |
| On the phone with friends | +1 min (±1) | +4 min (±3) | +1 min (±1) | +1 min (±1) | +0 min (±1) | +1 min (±1) | +1 min (±1) | +2 min (±2) |
Change in average minutes a day, 2003–05 to 2023–25, ± its margin. Time with friends, family, anyone and alone leaves out time at work.
What friends stopped doing together
What people were doing while a friend was there.
Ages 15–24: the biggest drop was TV and games, 27 min → 8 min a day.
Leaves out work and school class.
See the numbers
| With friends | Everyone | 15–24 | 25–34 | 35–44 | 45–54 | 55–64 | 65–74 | 75 and older |
|---|---|---|---|---|---|---|---|---|
| TV and games | 9 min → 4 min | 27 min → 8 min | 7 min → 6 min | 4 min → 2 min | 3 min → 2 min | 3 min → 2 min | 5 min → 2 min | 5 min → 3 min |
| Talking and hanging out | 11 min → 6 min | 22 min → 10 min | 11 min → 7 min | 8 min → 6 min | 7 min → 4 min | 8 min → 5 min | 9 min → 5 min | 9 min → 6 min |
| Getting places | 6 min → 3 min | 15 min → 7 min | 5 min → 3 min | 3 min → 2 min | 4 min → 1 min | 3 min → 2 min | 4 min → 2 min | 5 min → 2 min |
| Sports and exercise | 5 min → 3 min | 14 min → 9 min | 5 min → 3 min | 4 min → 2 min | 3 min → 2 min | 3 min → 2 min | 3 min → 2 min | 2 min → 2 min |
| Eating and drinking | 7 min → 4 min | 12 min → 6 min | 7 min → 5 min | 5 min → 3 min | 5 min → 3 min | 5 min → 3 min | 7 min → 3 min | 8 min → 4 min |
| Parties and events | 2 min → 1 min | 4 min → 1 min | 2 min → 1 min | 2 min → 1 min | 2 min → 1 min | 2 min → 1 min | 2 min → 0 min | 2 min → 1 min |
| Other free time | 3 min → 1 min | 7 min → 3 min | 3 min → 2 min | 2 min → 1 min | 2 min → 1 min | 2 min → 1 min | 2 min → 1 min | 3 min → 1 min |
| Everything else | 11 min → 5 min | 23 min → 8 min | 10 min → 5 min | 8 min → 4 min | 8 min → 4 min | 7 min → 3 min | 10 min → 4 min | 10 min → 4 min |
Average a day, 2003–05 → 2023–25. Each is give or take 3 minutes or less; hover or tap a bar for its own.
Calls didn’t fill the gap
Calls made up about 1 min of the 28 min lost each day.
−28 mina day with friends in person
+1 mina day on the phone with friends
The survey can’t see texting or social media, so it can’t say whether they filled the rest. Who still calls, and for how long
Is the drop real?
- Counted the same way every year. School class is left out of every year, since high schoolers stopped being asked about it in 2006.
- Friends weren’t relabeled. Time with neighbors and other adults didn’t rise as time with friends fell.
- 2020 stands apart. The survey paused for two months. It’s marked, not averaged in.
- Fewer people answer now. 58% took part in 2003, 26% in 2025. That could push the numbers either way.
If a friendship has drifted
- Go first. If you’ve drifted, they probably miss it too. Most people wait to be asked. Check before assuming
- Say what you miss. “I miss our Thursday dinners” is easier to answer than “We never hang out anymore.” Describe, don’t diagnose
- Make it small and specific. “Walk on Sunday morning?” is easier to say yes to than “Let’s catch up sometime.” Honest and hearable
General ideas from the principles Porcupine is built on, not advice for your situation.
Write to the friend you miss
Write it the way it comes out. I’ll show you if the quills are up, and a version with them down.
The Quills Check needs JavaScript. Please turn it on and reload the page.
Common questions
Is there a friendship recession?
In time spent together, yes. Americans 15 and older average 26 min a day with friends in person, down from 54 min in 2003–05, by Porcupine’s count from the American Time Use Survey. Every age lost about half.
Which age group lost the most time with friends?
People 15 to 24, in minutes: from 2 hr 5 min a day to 50 min. In 2003–05, 45% of them spent time with a friend on a given day; in 2023–25, 22%.
Did the pandemic cause it?
It started earlier. Time with friends was already down from 53 min a day in 2012–14 to 37 min in 2018–19. It fell further in 2020 and hasn’t come back.
Is it only men who are losing time with friends?
No. Men’s time with friends fell 52% and women’s 52% from 2003–05 to 2023–25, about the same share.
Where did the time go?
Mostly to time alone. For people 15 to 24, time alone outside work grew 1 hr 10 min a day, 45 min of it with a screen, and sleep grew 35 min. The survey can’t see whether texting or social media took any of it.
Does this count texting and calls?
No. The survey counts time with friends in person. Calls are counted on their own, and went up about 1 min a day.
Guides for friends
Just need the words?
Find the words with Porcupine
PorcupineMost friendships don’t end in a fight. They drift. I can help you find the words to reach back out, say what you’ve missed, or get ready to say it in person.
Porcupine is coming soon. Sign up to be one of the first to try it.
We’ll email you when Porcupine opens and when we add new tools. Unsubscribe anytime. Privacy
More from the data
- Who Fills Your Day?Partners, kids, friends and family, at every age
- How much time do couples spend together?5 hr 10 min a day, and what they do with it
- How much time do people spend with friends?By age, who sees friends least, and how it feels
- How much of your time with your parents is behind you?Pick your age to see your share
- How much time do people spend with family on the holidays?Thanksgiving, Christmas and five more holidays, by the clock
- What do neighbors complain about, and when?New York City’s 311 complaints, by hour, week and season
- How often do people ask for a raise, or for help with money?Who asks, who gets a raise, and who gets help paying the bills
- How often do renters need repairs, or fall behind on rent?Repairs, rent and running late, for renters
- Do Americans still know their neighbors?Evenings with neighbors, friends and family since the 1970s
- When are people most alone, and who still calls?The hour the most people are alone, and who still calls
- How has the way we say sorry changed?Sorry, pardon and “sorry if,” in books since 1800
- Do couples agree on who does more at home?Chores, money and marriage, as women and men each tell it
- When did therapy-speak go mainstream?Boundaries, ghosting, gaslighting: in books, on Wikipedia and in searches
- What people asked advice columns, then and nowCourting faded, family took its place: 28,539 letters, a hundred years apart
- Etiquette then and now: which of Emily Post’s rules on what to say still hold?Her 73 rules from 1922: we’d keep 50, and every one we’d change said to keep your feelings, wants or questions to yourself
How we counted
- Each person in the survey goes through one day, hour by hour, and who was with them: in the same room at home, or with them when out. In the United States, they go through the day before with an interviewer on the phone. Calls, texts and video chats don’t count, and nobody is asked who was there while they slept, washed or dressed.
- Every number is an average from a sample, weighted to stand for people 15 and older living in their own homes, so each comes with a margin of error. Hover or tap a chart to see it. Numbers too uncertain to trust are left out.
More on how we counted
- Time can count twice: a dinner with a partner and the kids counts for both.
- The lifetime chart compares people of different ages today, not one life followed over the years.
- The 2025 US numbers have no diaries from September 30 to November 11, when a federal shutdown stopped the survey. The Bureau of Labor Statistics says it can’t measure the effect, though the survey has shown little change by season in the past.
- Time with friends is every activity with a friend there, leaving out time at work and in school class in every year: who was there at work wasn’t asked before 2010, and high schoolers stopped being asked who was in class in 2006. The Bureau of Labor Statistics’ own total counts class in 2003–2005 only, so it starts a few minutes higher.
- Ages are a few years together (two either side of 2020), since a single year has as few as a few hundred diaries for one age. “Then” is 2003–05 and “now” 2023–25. A change counts as one only when it’s bigger than its margin of error, and a biggest drop is named only when it leads the next by more than both margins.
- “Alone with a screen” is TV, movies, games and computer use for fun with no one else there. Sleep includes lying awake. Calls are calls to or from friends, neighbors or acquaintances. The survey can’t see texts or social media well, since people rarely list a text as something they did.
- 2020 has no diaries from mid-March to mid-May and its own weights. Response to the survey fell from 57.8% of the people asked in 2003 to 25.7% in 2025 (ATUS User’s Guide); the weights make up for who answers by age, sex and more, but not for how social they are. Time with neighbors and acquaintances stayed between 4 and 10 minutes a day, so friends weren’t simply called something else.
- Source: Porcupine’s analysis of the American Time Use Survey, US Bureau of Labor Statistics, which hasn’t reviewed these pages, 2003–2025, 258,954 one-day diaries, with margins of error from the survey’s replicate weights.
Updated